2023 CLMP Report
2023 CLMP Report for Rose Lake/Lake of the Woods
The 2023 Cooperative Lakes Monitoring Program report is here and you can view it by clicking on the link above. The Lake Health Committee has included the different tests, their meanings, and our understanding of the data.
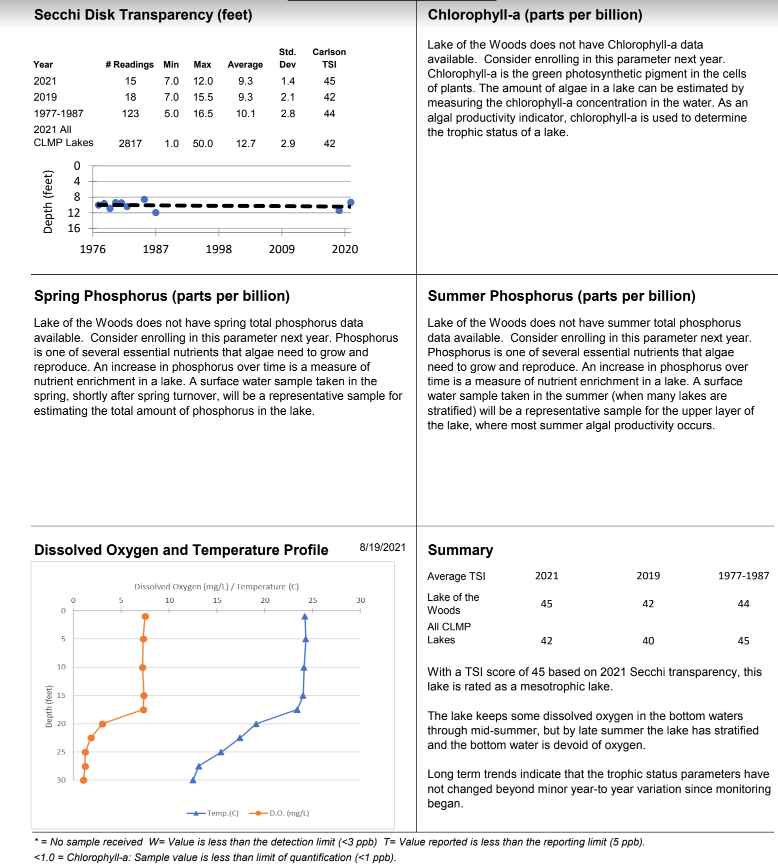
Secchi Disk Transparency (Water Clarity). Since 1976 the water clarity on Rose Lake has stayed at an average depth of 10 - 11 feet and is holding steady. We are slightly below average with other lakes in Michigan. This number is produced by taking the average of when the disk disappears and reappears in the water.
Chlorophyll-a, the green pigment in plants, absorbs sunlight and servers as the oxygen production site. This is also a measure of algae. Algae is the most common reason for low water quality readings. Although our Chlorophyll-a numbers are trending downward, this test started only two years ago. We will need further data to see any relevant trends. Our Chlorophyll-a readings are lower than most inland Michigan lakes.
Spring/Summer Phosphorus promotes excessive aquatic plant growth. Phosphorus originates from a variety of sources, many of which are related to human activities. Major sources include human and animal wastes, soil erosion, detergents, septic systems and runoff from farmlands and/or lawns. For the past two years, the spring/summer phosphorus numbers are decreasing but with only two years data, we will continue to assess long term trends.
Dissolved Oxygen is undoubtedly the most important of the gases, since most aquatic organisms need it to survive. The ability of oxygen and other gases to be present depends on water temperature. The colder the water, the more gases it can hold. Boiling water removes all gases. As you can see in the report, our lake runs out of oxygen at the bottom by late summer as the temperatures in the water rise.
Trophic Status of a lake is the nutrient level measurement from the beginning, middle and end of its life span. Yes, lakes could and have had endings. Our nutrient level has improved since testing began in 1976. Rose Lake’s average trophic status is: 39 and that number puts her in the early middle age of her life span.
We thank you for taking a moment to view this important information about Rose Lake/Lake of the Woods water quality. Since the Lake Health committee was formed three years ago, we are well on our way to making a positive impact on the health of the lake. Thank you to everyone involved for your hard work, dedication, and support.
2023 Summer and Fall Water Quality Report
We are reporting the summer and fall numbers together this year. Our early summer numbers were taken after the 4th of July and our Fall numbers were taken in early October. We are starting to only do 3 samplings for our water quality reports moving forward. During the summer samplings the biggest standout was the E.Coli number where the farm field ditches enter into Betts Ditch. This number was very alarming. Working to reduce this number is our number one priority this winter. Our Fall samples are within healthy ranges for all areas. The biggest jump from last year was our Total Suspended Solids. Which means we have more algae present toward the end of our season. This actually makes sense because of the high E.Coli numbers coming from the previous early summer tests. All that nutrient overload has exited the channel and is now providing a fertile arena for algae to grow. We will keep you posted as to how we are addressing the E.Coli numbers throughout the winter. Thank you to all the volunteers who take the time to sample the water and analyze the numbers to keep all of you informed. Also thank you for all the Lake Health donations. Looking forward to seeing all of you next year!

pH is an indication of our lake's acid level. Neutral water, like distilled water, has a 7 pH level. Any measurement below 7 is considered acidic. Low pH levels affect fish spawning to the point of extinction. For humans, low pH levels increase the concentration of heavy metals like aluminum, zinc, and mercury.
When there are high E. coli counts there are three indicators in a lake to consider rain, large presence of waterfowl, and many people. Rain produces ground water that runs into the lake and carries with it E. coli. Bird feces contribute disease causing bacteria to the water. And, beach areas with many people swimming tend to have higher levels of E. coli.
Dissolved Oxygen Oxygen (O2) is undoubtedly the most important of the gases, since most aquatic organisms need it to survive. The solubility of oxygen and other gases depends on water temperature. The colder the water, the more gases it can hold. Boiling water removes all gases. Oxygen is produced whenever green plants grow. Plants use carbon dioxide and water to produce simple sugars and oxygen, using sunlight as the energy source.
Phosphorus promotes excessive aquatic plant growth. Phosphorus originates from a variety of sources, many of which are related to human activities. Major sources include human and animal wastes, soil erosion, detergents, septic systems and runoff from farmlands or lawns.
The Total Suspended Solids numbers relate to water clarity, especially the amount of algae present.
Nitrogen is second only to phosphorus as an important nutrient for plant and algae growth. Precipitation is usually the main nitrogen source for seepage and some drainage lakes. In most cases, however, the amount of nitrogen in lake water corresponds to local land use. Nitrogen may come from fertilizer and animal wastes on agricultural lands, human waste from sewage treatment plants or septic systems, and lawn fertilizers used on lakeshore property. Nitrogen may enter a lake from surface runoff or groundwater sources.
2023 Spring Water Quality Report
Welcome back to the lake everyone! This is our 3rd year with the new tracking system. Our Spring water quality sampling took place on May 16th and all the numbers came back within normal ranges. A few tests that stand out. The Dissolved Oxygen level for each testing site is higher compared to last Spring. Cooler waters maybe the explanation because they hold more oxygen for plant and fish life. The E.coli level at the Grass Lake Rd. test site is the lowest Spring level in 3 years. This is good news as we move into the summer lake season. Suspended Solids at the Betts Ditch sample site is up quite a bit even though it is still within healthy ranges. Nitrates, Nitrogen levels are steadily increasing in our lakes every year. While they are within normal range, the levels are the highest in 3 years across all test sites. Please read below for more information on how nitrogen has an effect on water quality and how it enters our lakes. We all have a responsibility to keep our lakes clean. Thank you. -Lake Health Committee

pH is an indication of our lake's acid level. Neutral water, like distilled water, has a 7 pH level. Any measurement below 7 is considered acidic. Low pH levels affect fish spawning to the point of extinction. For humans, low pH levels increase the concentration of heavy metals like aluminum, zinc, and mercury.
When there are high E. coli counts there are three indicators in a lake to consider rain, large presence of waterfowl, and many people. Rain produces ground water that runs into the lake and carries with it E. coli. Bird feces contribute disease causing bacteria to the water. And, beach areas with many people swimming tend to have higher levels of E. coli.
Dissolved Oxygen Oxygen (O2) is undoubtedly the most important of the gases, since most aquatic organisms need it to survive. The solubility of oxygen and other gases depends on water temperature. The colder the water, the more gases it can hold. Boiling water removes all gases. Oxygen is produced whenever green plants grow. Plants use carbon dioxide and water to produce simple sugars and oxygen, using sunlight as the energy source.
Phosphorus promotes excessive aquatic plant growth. Phosphorus originates from a variety of sources, many of which are related to human activities. Major sources include human and animal wastes, soil erosion, detergents, septic systems and runoff from farmlands or lawns.
The Total Suspended Solids numbers relate to water clarity, especially the amount of algae present.
Nitrogen is second only to phosphorus as an important nutrient for plant and algae growth. Precipitation is usually the main nitrogen source for seepage and some drainage lakes. In most cases, however, the amount of nitrogen in lake water corresponds to local land use. Nitrogen may come from fertilizer and animal wastes on agricultural lands, human waste from sewage treatment plants or septic systems, and lawn fertilizers used on lakeshore property. Nitrogen may enter a lake from surface runoff or groundwater sources.
Fall 2022 Water Quality Report
Our Fall water quality testing is complete. Instead of just doing E.coli sampling the committee decided to do the full scope so we had a least two years of data for comparison. All our Fall numbers are well within healthy limits. Over all our water quality was good for 2022. The E.coli numbers at the Grass Lake Road sample site are our biggest concern. We plan on taking these numbers to the Branch County health department for some guidance to figure out exactly where it is coming from and why in such high amounts. Thank you to all our volunteers who set aside their time to help monitor our lakes. Thank you to all our members who donate each year. See you next summer!

pH is an indication of our lake's acid level. Neutral water, like distilled water, has a 7 pH level. Any measurement below 7 is considered acidic. Low pH levels affect fish spawning to the point of extinction. For humans, low pH levels increase the concentration of heavy metals like aluminum, zinc, and mercury.
When there are high E. coli counts there are three indicators in a lake to consider rain, large presence of waterfowl, and many people. Rain produces ground water that runs into the lake and carries with it E. coli. Bird feces contribute disease causing bacteria to the water. And, beach areas with many people swimming tend to have higher levels of E. coli.
Dissolved Oxygen Oxygen (O2) is undoubtedly the most important of the gases, since most aquatic organisms need it to survive. The solubility of oxygen and other gases depends on water temperature. The colder the water, the more gases it can hold. Boiling water removes all gases. Oxygen is produced whenever green plants grow. Plants use carbon dioxide and water to produce simple sugars and oxygen, using sunlight as the energy source.
Phosphorus promotes excessive aquatic plant growth. Phosphorus originates from a variety of sources, many of which are related to human activities. Major sources include human and animal wastes, soil erosion, detergents, septic systems and runoff from farmlands or lawns.
The Total Suspended Solids numbers relate to water clarity, especially the amount of algae present.
Nitrogen is second only to phosphorus as an important nutrient for plant and algae growth. Precipitation is usually the main nitrogen source for seepage and some drainage lakes. In most cases, however, the amount of nitrogen in lake water corresponds to local land use. Nitrogen may come from fertilizer and animal wastes on agricultural lands, human waste from sewage treatment plants or septic systems, and lawn fertilizers used on lakeshore property. Nitrogen may enter a lake from surface runoff or groundwater sources.
Late Summer and Last Water Quality Report for 2022
Our latest water quality numbers are in and the environmental committee has decided to save some association money and just do E.coli testing for our Fall sampling. E.coli seems to be our biggest concern. Our late summer water quality readings showed normal ranges in all areas but E. coli at the Grass Lake Road sampling area. In addition to the collection for water quality reports, we also participate in the Cooperative Lakes Monitoring Program. We’ll share our 2022 Secchi Disk transparency, Chlorophyll-a, and Phosphorus measurements for Spring and Summer results in early Spring of 2023. Thank you to or volunteers who helped collect and transport samples. Thank you to Sandhill Environmental for providing professional testing. Lastly, thank you to all the residents who donated to help fund the ongoing monitoring of our lakes. Multiple years of data will help us track any undesirable trends.

pH is an indication of our lake's acid level. Neutral water, like distilled water, has a 7 pH level. Any measurement below 7 is considered acidic. Low pH levels affect fish spawning to the point of extinction. For humans, low pH levels increase the concentration of heavy metals like aluminum, zinc, and mercury.
When there are high E. coli counts there are three indicators in a lake to consider rain, large presence of waterfowl, and many people. Rain produces ground water that runs into the lake and carries with it E. coli. Bird feces contribute disease causing bacteria to the water. And, beach areas with many people swimming tend to have higher levels of E. coli.
Dissolved Oxygen Oxygen (O2) is undoubtedly the most important of the gases, since most aquatic organisms need it to survive. The solubility of oxygen and other gases depends on water temperature. The colder the water, the more gases it can hold. Boiling water removes all gases. Oxygen is produced whenever green plants grow. Plants use carbon dioxide and water to produce simple sugars and oxygen, using sunlight as the energy source.
Phosphorus promotes excessive aquatic plant growth. Phosphorus originates from a variety of sources, many of which are related to human activities. Major sources include human and animal wastes, soil erosion, detergents, septic systems and runoff from farmlands or lawns.
The Total Suspended Solids numbers relate to water clarity, especially the amount of algae present.
Nitrogen is second only to phosphorus as an important nutrient for plant and algae growth. Precipitation is usually the main nitrogen source for seepage and some drainage lakes. In most cases, however, the amount of nitrogen in lake water corresponds to local land use. Nitrogen may come from fertilizer and animal wastes on agricultural lands, human waste from sewage treatment plants or septic systems, and lawn fertilizers used on lakeshore property. Nitrogen may enter a lake from surface runoff or groundwater sources.
2022 Early Summer Water Quality Report
Our early summer testing took place July 7th after the holiday. Maybe you saw our video on Facebook. You may also remember we had just gotten 6 inches of rain. Because of that rain our E.Coli numbers were way off. We decided to retest and the numbers, while still up from last year, all the sites, except Grass Lake Rd., are within normal range. Just a reminder the arrows indicate where the numbers are from last year. Please review the definitions below to help you understand the results.
Thank you,
Environmental Committee

pH is an indication of our lake's acid level. Neutral water, like distilled water, has a 7 pH level. Any measurement below 7 is considered acidic. Low pH levels affect fish spawning to the point of extinction. For humans, low pH levels increase the concentration of heavy metals like aluminum, zinc, and mercury.
When there are high E. coli counts there are three indicators in a lake to consider rain, large presence of waterfowl, and many people. Rain produces ground water that runs into the lake and carries with it E. coli. Bird feces contribute disease causing bacteria to the water. And, beach areas with many people swimming tend to have higher levels of E. coli.
Dissolved Oxygen Oxygen (O2) is undoubtedly the most important of the gases, since most aquatic organisms need it to survive. The solubility of oxygen and other gases depends on water temperature. The colder the water, the more gases it can hold. Boiling water removes all gases. Oxygen is produced whenever green plants grow. Plants use carbon dioxide and water to produce simple sugars and oxygen, using sunlight as the energy source.
Phosphorus promotes excessive aquatic plant growth. Phosphorus originates from a variety of sources, many of which are related to human activities. Major sources include human and animal wastes, soil erosion, detergents, septic systems and runoff from farmlands or lawns.
The Total Suspended Solids numbers relate to water clarity, especially the amount of algae present.
Nitrogen is second only to phosphorus as an important nutrient for plant and algae growth. Precipitation is usually the main nitrogen source for seepage and some drainage lakes. In most cases, however, the amount of nitrogen in lake water corresponds to local land use. Nitrogen may come from fertilizer and animal wastes on agricultural lands, human waste from sewage treatment plants or septic systems, and lawn fertilizers used on lakeshore property. Nitrogen may enter a lake from surface runoff or groundwater sources.
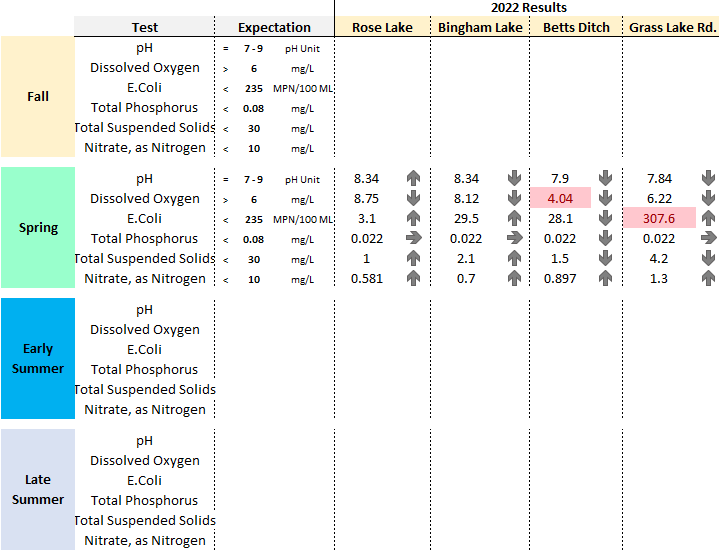
2022 Spring Water Quality Report
On May 31st the Water Quality Team collected samples for our first seasonal water tests. When you see a RED box that means the numbers our out of normal range. This our second year reporting this way and the ARROWS show how the numbers changed from last year. Our Spring water quality, except for two areas, are in line with the standards. It looks as if some of the indicators in the main lake have risen since last year and Bingham’s E.Coli went up so we are watching that. Be assured that the Bingham E.Coli reading is well below the maximum of 235. Betts Ditch is what does all the filtering so with the high count of E.Coli again there, it drops substantially once the water makes it to the lakes. We did talk to an EGLE representative who wasn’t to alarmed and our water quality team is going to report these numbers to the local health department. The low dissolved oxygen reading at Betts Ditch shows that there is not enough oxygen to sustain fish life. We get that oxygen back in our lakes with the natural movement and air. This spring results and definitions are below:
pH is an indication of our lake's acid level. Neutral water, like distilled water, has a 7 pH level. Any measurement below 7 is considered acidic. Low pH levels affect fish spawning to the point of extinction. For humans, low pH levels increase the concentration of heavy metals like aluminum, zinc, and mercury.
When there are high E. coli counts there are three indicators in a lake to consider rain, large presence of waterfowl, and many people. Rain produces ground water that runs into the lake and carries with it E. coli. Bird feces contribute disease causing bacteria to the water. And, beach areas with many people swimming tend to have higher levels of E. coli.
Dissolved Oxygen Oxygen (O2) is undoubtedly the most important of the gases, since most aquatic organisms need it to survive. The solubility of oxygen and other gases depends on water temperature. The colder the water, the more gases it can hold. Boiling water removes all gases. Oxygen is produced whenever green plants grow. Plants use carbon dioxide and water to produce simple sugars and oxygen, using sunlight as the energy source.
Phosphorus promotes excessive aquatic plant growth. Phosphorus originates from a variety of sources, many of which are related to human activities. Major sources include human and animal wastes, soil erosion, detergents, septic systems and runoff from farmlands or lawns.
The Total Suspended Solids numbers relate to water clarity, especially the amount of algae present.
Nitrogen is second only to phosphorus as an important nutrient for plant and algae growth. Precipitation is usually the main nitrogen source for seepage and some drainage lakes. In most cases, however, the amount of nitrogen in lake water corresponds to local land use. Nitrogen may come from fertilizer and animal wastes on agricultural lands, human waste from sewage treatment plants or septic systems, and lawn fertilizers used on lakeshore property. Nitrogen may enter a lake from surface runoff or groundwater sources.
CLMP 2021 Data Report
At the end of every year of water quality testing with the Cooperative Lakes Monitoring Program, we receive a report outlining our results. In 2021 we participated in 2 of the 5 parameters. These included Secchi Disk readings that look at water clarity and Dissolved Oxygen which measures the amount of oxygen available in our lakes available to plants and animals. The more consecutive years of data we collect from the lakes the easier it is to see positive and negative trends to help us understand the steps we need to take to keep our lakes healthy. Please look through the report and direct any questions to our email address info@myroselake.com.